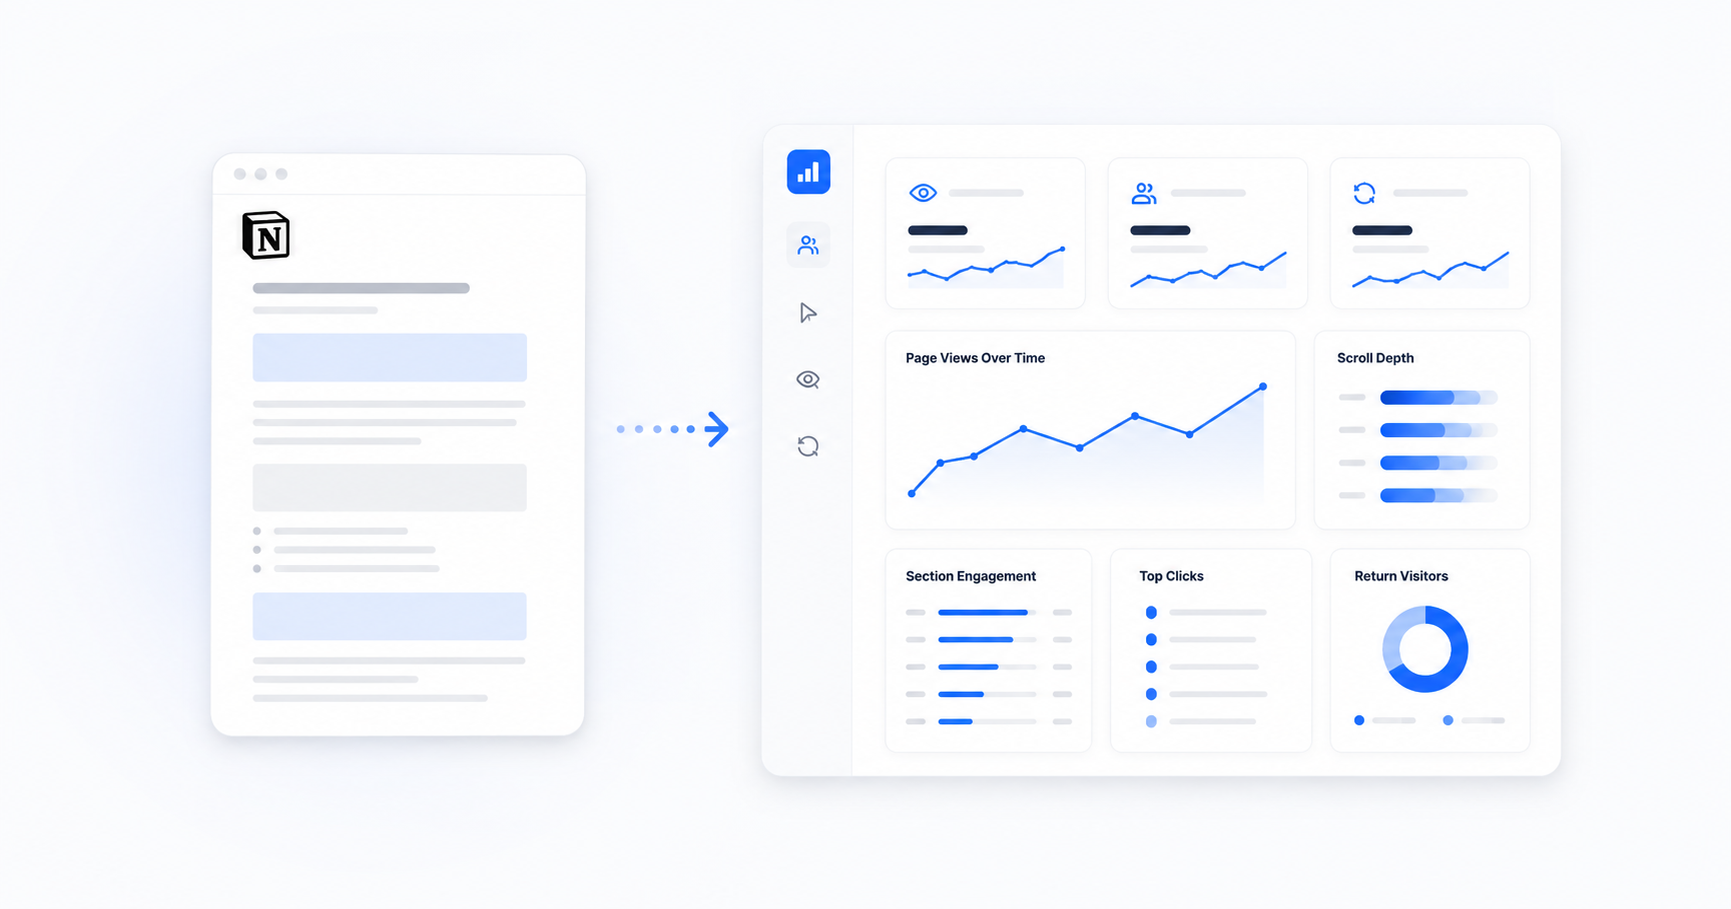
How Associations Can Measure Member Publication Engagement
Association publications often require significant editorial time, design work, subject-matter review, and distribution effort. Yet after an issue is sent, many teams are left with only a delivery count, a download count, or anecdotal feedback.
Those numbers do not answer the questions that matter to a publication team:
- How many people viewed the issue?
- How long did they engage?
- Which pages or topics received the most attention?
- Where did readership drop off?
- How many readers returned?
- How did engagement change during the measurement period?
A useful measurement framework should answer those questions without pretending analytics can prove what a person understood or believed.
Start with the purpose of the publication
Before selecting metrics, write down what the publication is expected to accomplish. A quarterly magazine may be designed to inform members, increase awareness of programs, explain regulatory changes, or strengthen connection with the profession. An annual report may need to demonstrate accountability. A technical bulletin may need to help readers find a specific update quickly.
The purpose changes how the data should be interpreted. A short visit to a directory can be successful if the reader immediately finds a phone number. The same short visit to a detailed policy explanation may suggest that the introduction or navigation needs work.
The six-metric publication framework
1. Readership
Start with the number of readers or viewing sessions. Keep identified readers and anonymous sessions separate. A shared link can produce several sessions from one person, while a household or office device can sometimes be used by more than one person.
Report the definition beside the number. For example: "412 viewing sessions, including 286 identified readers." Clear definitions make comparisons between issues much more reliable.
2. Engaged time
Engaged time is more useful than total time when it attempts to exclude periods when the document is open but inactive. Review median time as well as average time. A few unusually long sessions can pull an average upward.
Compare time with issue length. A ten-minute median may be strong for a short bulletin but modest for a 60-page magazine.
3. Page and topic attention
Page-level activity shows which parts of the publication were reached and where readers spent time. A PDF heatmap can add spatial clues within a page, but it should not be described as eye-tracking.
For editorial reporting, map pages to topics. Instead of saying only "page 14 performed well," report that "the continuing education section received the highest median engaged time." Topic labels make the finding usable by people who do not know the page layout.
4. Reading drop-off
Plot the percentage of sessions that reached each page. The shape of the curve often matters more than a single completion rate.
A sharp decline immediately after the cover may point to loading, navigation, or expectation problems. A gradual decline through a long issue is normal. A decline before an important policy section may support moving that section earlier, linking directly to it, or promoting it separately.
Drop-off does not prove dislike. A reader may have found what they needed or been interrupted. Treat it as a place to investigate.
5. Return readership
A return visit can indicate that a document remained useful, was reviewed in stages, or was revisited when a decision was required. The measurement depends on the access configuration and the way sessions are associated.
Use viewer identification guidance to decide whether the publication needs anonymous aggregate measurement, recipient-specific links, or an identity gate. Do not call every new session a new person.
6. Change over time
Compare consistent metrics across the distribution period and across issues. Useful comparisons include first-week readership, median engaged time, topic attention, return rate, and the percentage reaching priority sections.
Record major differences in distribution size, issue length, email subject line, or audience composition. Otherwise, a change caused by distribution may be mistaken for an editorial change.
A simple publication report
A concise issue report can fit on one page:
| Question | Recommended measure | Editorial use |
|---|---|---|
| How many viewed it? | Identified readers and viewing sessions | Understand reach |
| How long did they engage? | Median and average engaged time | Compare depth |
| What earned attention? | Page reach, dwell, and topic summaries | Plan future coverage |
| Where did readers stop? | Reach curve and notable exits | Improve structure |
| How many returned? | Returning readers or repeat sessions | Identify lasting utility |
| What changed? | Period and issue comparisons | Evaluate experiments |
Add two short sections: "What we learned" and "What we will test next." This keeps the report connected to decisions instead of becoming a collection of charts.
Run small editorial experiments
Change one meaningful variable at a time when possible. Examples include moving a regulatory update earlier, adding a linked contents page, shortening a long introduction, or promoting one article directly in the distribution email.
Define the expected result before publication. If the team moves a section earlier, the expected result might be a larger share of readers reaching it, not necessarily a longer total session.
Respect the reader
Use analytics proportionately. Explain tracking where required, collect only what serves a defined purpose, limit access to the data, and establish a retention period. Individual identity is not necessary for every publication.
Document analytics is best used to improve communication, not to make unsupported judgments about individual members. Engagement shows behavior in a viewing experience. It does not prove comprehension, agreement, or professional intent.
For a closer look at the complete workflow, see document analytics for associations and the heatmap methodology.
Understand what happens after you share.
Measure readership, page attention, return visits, and engagement across the documents your organization publishes.
Try Tracklytics free →