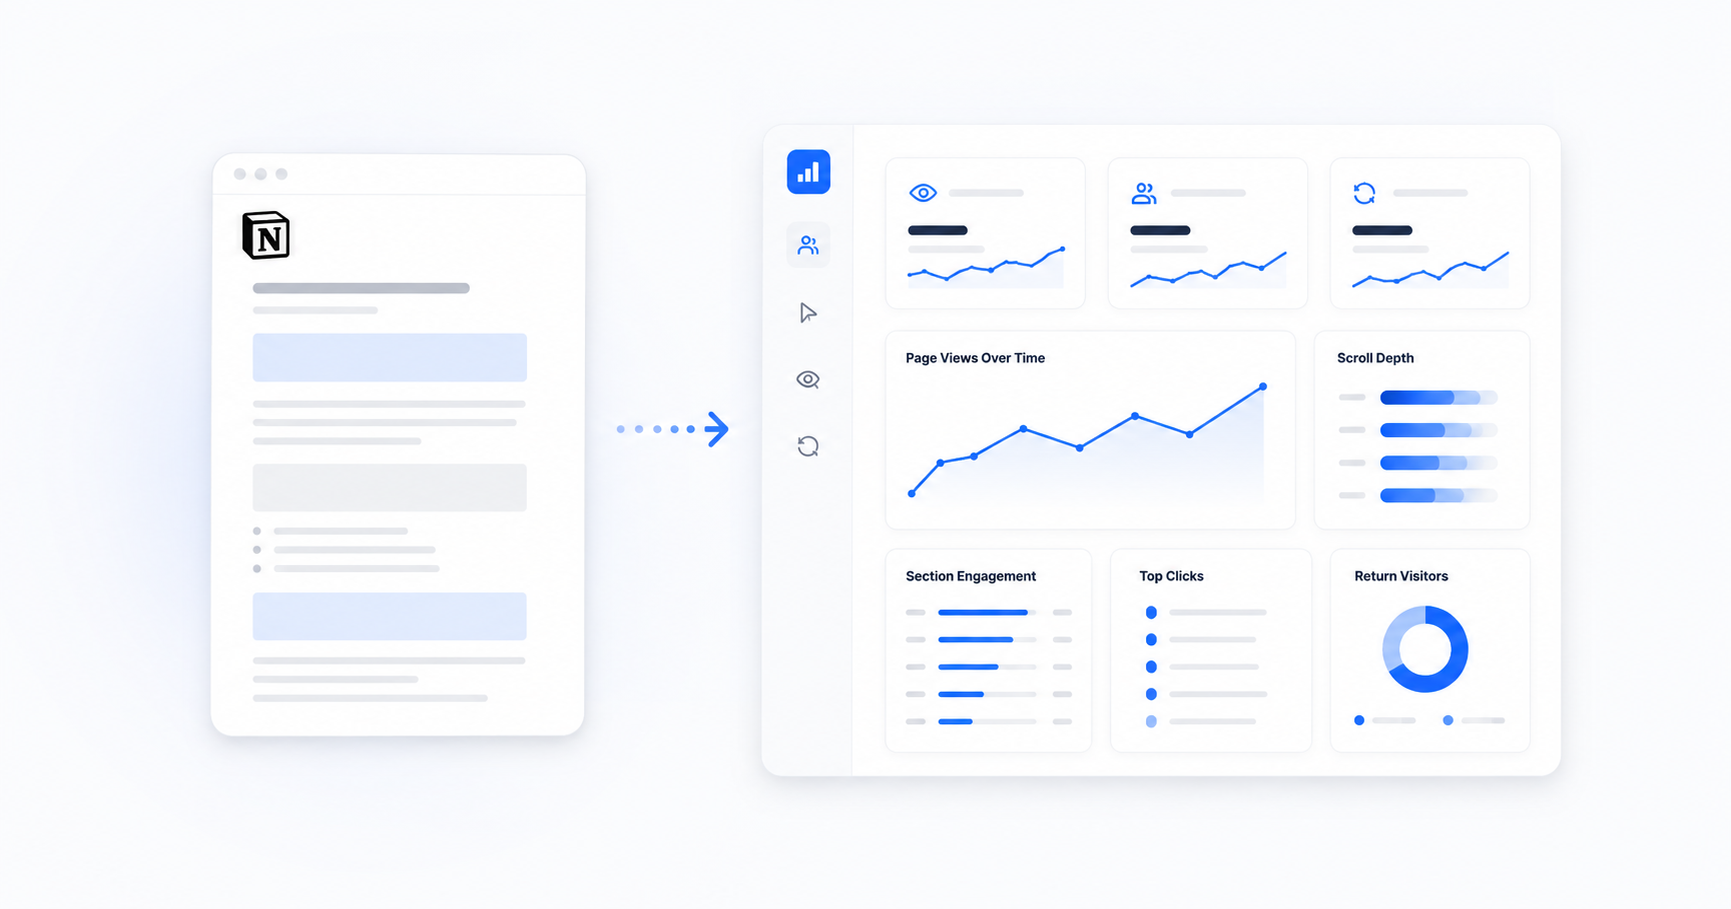
From PDF Analytics to Better Editorial Decisions
A publication dashboard is useful only when it helps a team make a better decision. More charts do not automatically create more insight.
For associations, agencies, public bodies, and communications teams, the most productive review is usually short: identify the strongest pattern, choose one change, and decide what evidence would indicate improvement in the next issue.
Separate signals from conclusions
Document analytics records behavior. It does not read a person's mind.
A high-time page may contain valuable material, confusing material, or simply a dense table. A low-time page may be clear and efficient, or it may have been skipped. A return visit may indicate lasting value, an interrupted first session, or a need to verify a detail.
Begin every finding with "the data shows" and separate it from "our working explanation." This prevents a plausible interpretation from being presented as fact.
Use four editorial lenses
Reach
Page reach answers whether readers arrived at a section. If an important article has low reach, first examine its position, navigation, and promotion. The content itself cannot earn attention if most readers never encounter it.
Possible action: move a high-priority section earlier, link directly to it from the contents page, or feature it in the distribution message.
Depth
Engaged time and page activity help distinguish a quick pass from a deeper interaction. Compare median time across similar content types instead of treating every page equally.
Possible action: preserve formats that repeatedly earn meaningful attention, such as practical checklists, case examples, or visual summaries.
Friction
Sharp drop-off, repeated backtracking, or concentrated activity around navigation elements can suggest a structural problem. These signals do not prove confusion, but they identify areas worth reviewing.
Possible action: simplify navigation, break a long article into sections, improve headings, or provide a short summary before technical detail.
Return value
Return visits suggest that a publication or section remained useful after the initial distribution. This may be especially important for technical guidance, reference tables, benefit information, and regulatory updates.
Possible action: make high-return material easier to find, create a permanent resource page, or link to it in future communications.
Build a topic map
Page numbers are not a content strategy. Add a topic label to each page or page range, such as governance, continuing education, policy, member profile, research, events, or benefits.
Then summarize the publication by topic:
| Topic | Reach | Median engaged time | Return activity | Working interpretation |
|---|---|---|---|---|
| Regulatory update | High | High | High | Important reference content |
| Member profile | High | Medium | Low | Strong first-read interest |
| Events calendar | Medium | Low | High | Readers return for dates |
| Opening message | High | Low | Low | Reached but read quickly |
The final column should remain a hypothesis until supported by feedback or repeated patterns.
Tracklytics can support page and topic analysis through its document analytics for associations workflow. Spatial interaction patterns can be reviewed alongside page metrics using PDF heatmap analytics.
Review one issue in 30 minutes
A practical review meeting can follow this structure:
- Confirm the measurement period and distribution context.
- Review readership and median engaged time.
- Identify the three topics with the strongest attention.
- Find the largest unexpected decline in page reach.
- Review which content produced return visits.
- Select one editorial change and one distribution change.
- Record what the team expects to happen next time.
Avoid reviewing every page in equal detail. Start with the exceptions and the questions tied to the publication's purpose.
Compare fairly across issues
Raw totals can mislead when one issue reaches a larger audience or contains more pages. Normalize where useful:
- Report reach as a percentage of sessions.
- Compare median time by content type.
- Calculate priority-section reach from the same starting definition.
- Separate first-week activity from the full measurement period.
- Note material changes in distribution and access settings.
Maintain the same topic taxonomy for several issues before changing it. Consistency creates a usable trend line.
Pair analytics with feedback
Behavioral data is strongest when combined with direct evidence. A short member survey can ask whether the issue was useful, what readers want next, and whether a key update was understood. Editorial interviews can explain why a pattern occurred.
Use analytics to decide where to ask better questions. Use feedback to test the explanation.
End with a decision log
For every issue, record:
- the observation
- the likely explanation
- the change being tested
- the expected result
- the next review date
This creates organizational memory and prevents a future team from repeating the same debate without evidence.
The goal is not to optimize every number. It is to make important information easier to find, easier to understand, and more useful to the audience.
Understand what happens after you share.
Measure readership, page attention, return visits, and engagement across the documents your organization publishes.
Try Tracklytics free →