What Is a Document Heatmap? Why Sales Teams Use Them
What Is a Document Heatmap?
Why Sales Teams Use Them to Improve Follow-Ups
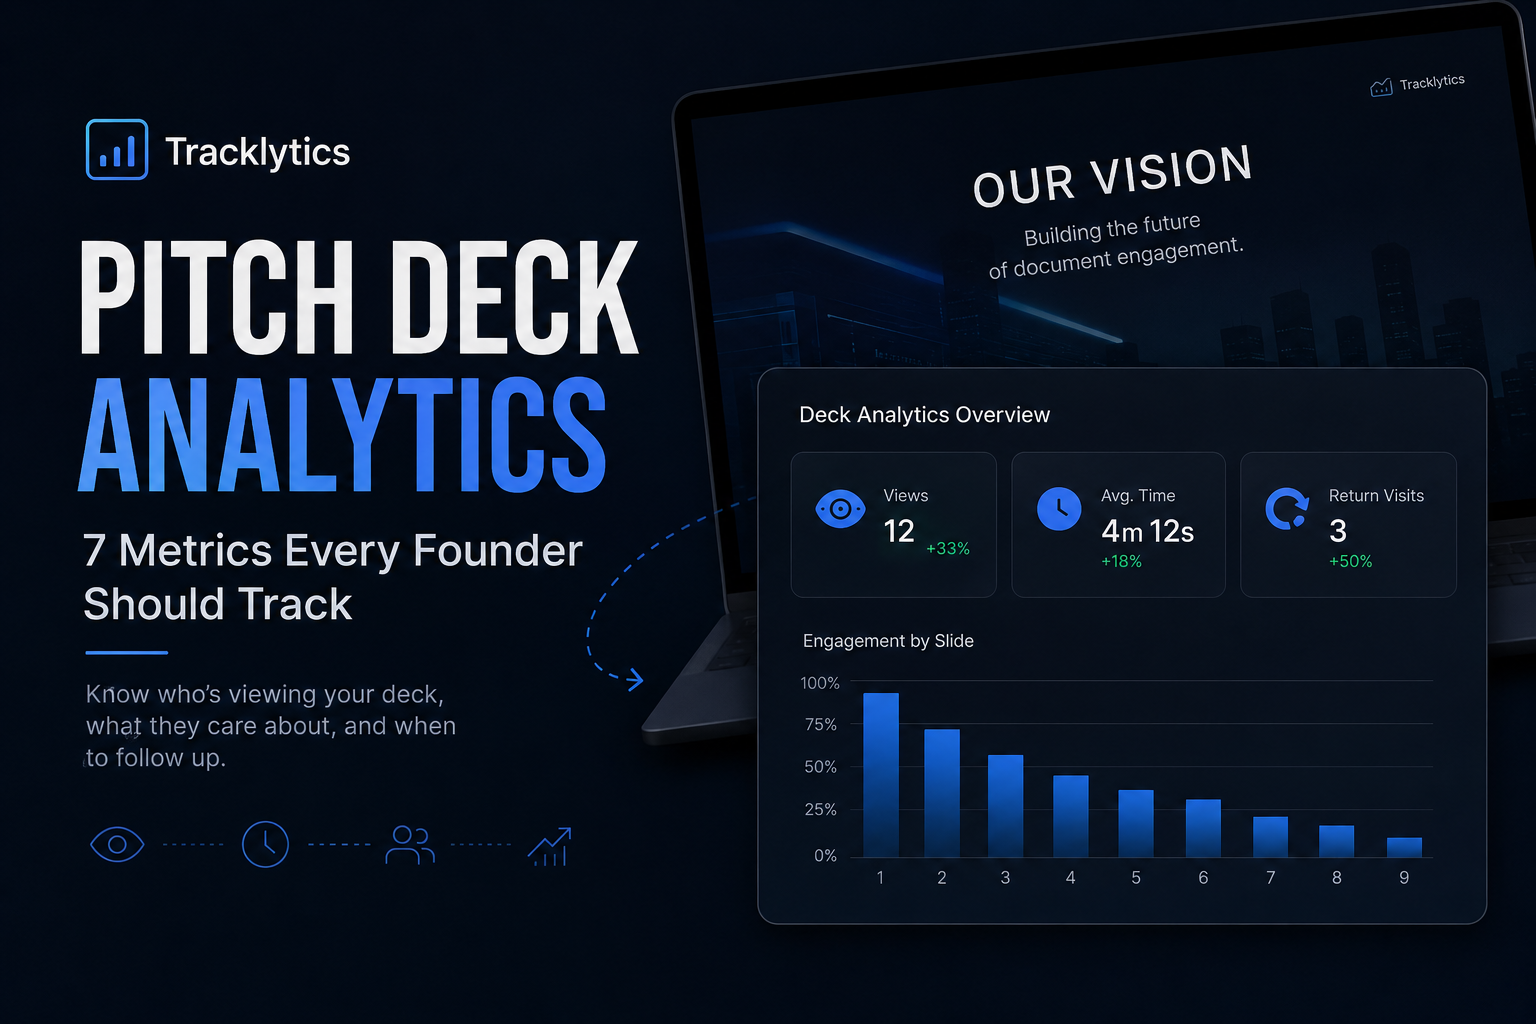
You sent a 12-page proposal. The prospect spent 14 seconds on it.
But where did those 14 seconds go?
Did they skim the intro? Jump straight to pricing? Click the case study? Stop before they reached the offer?
A normal PDF cannot answer those questions. A document heatmap can.
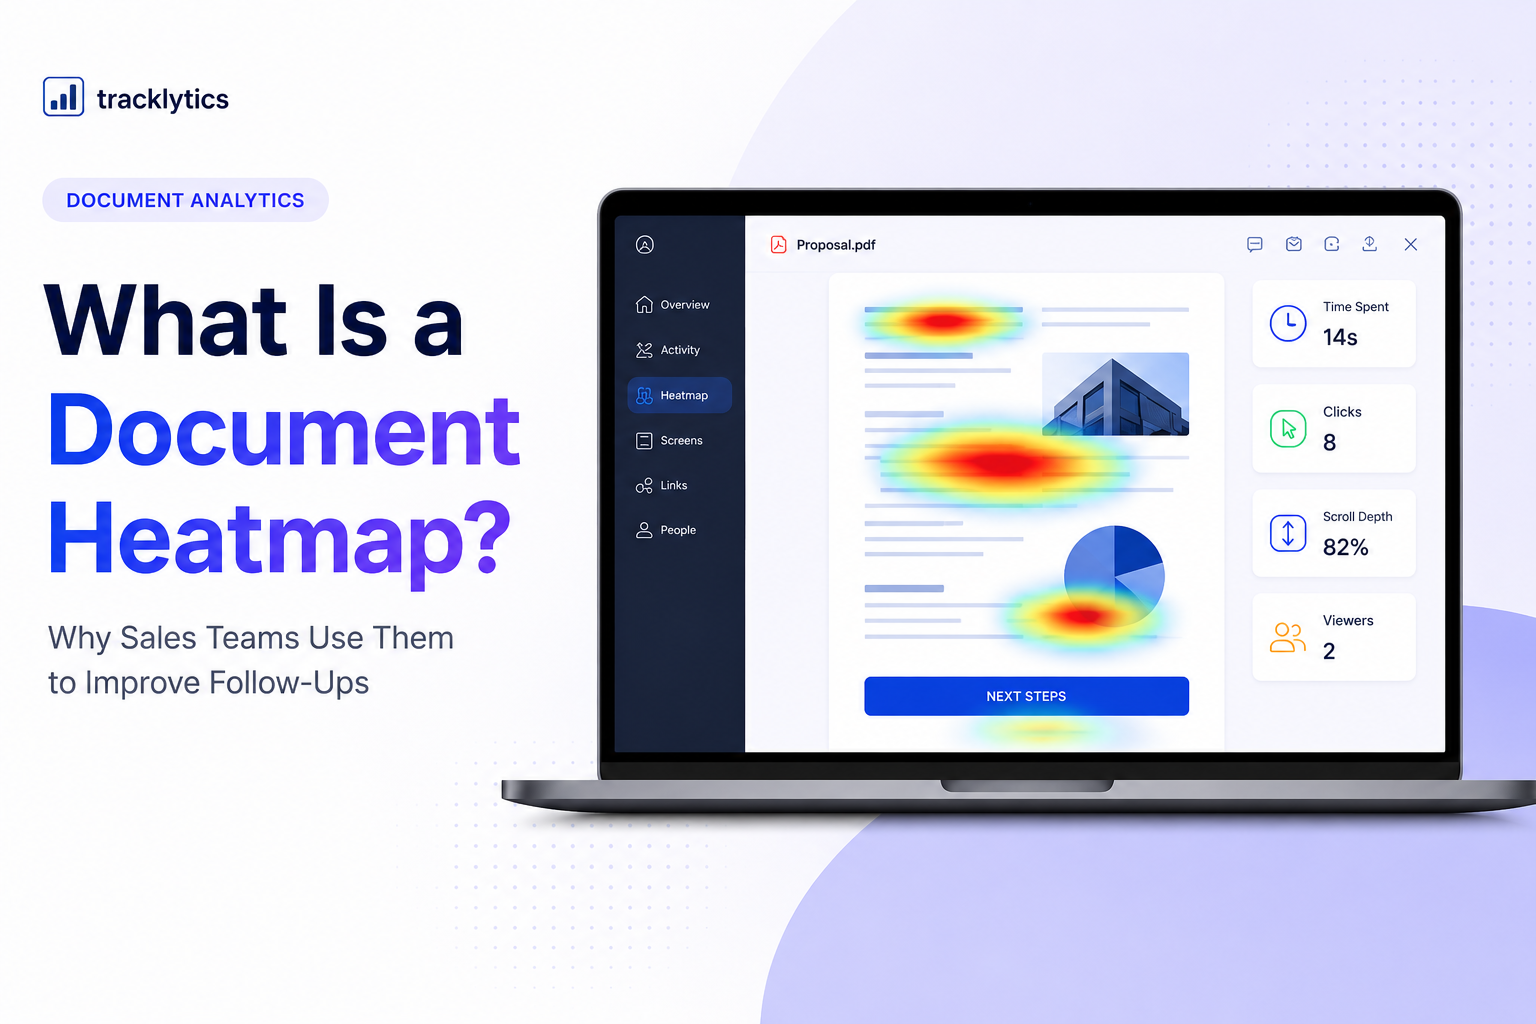
A document heatmap shows how people interact with your PDF, pitch deck, proposal, or report. Instead of only seeing that someone opened the file, you can understand where they clicked, how far they scrolled, which pages they viewed, and which parts of the document held their attention.
For sales teams, that turns a silent document into a source of buyer intent.
It does not tell you exactly what the buyer is thinking. But it gives you useful engagement signals so you can follow up with better timing and better context.
What Is a Document Heatmap?
A document heatmap is a visual overlay that shows reader engagement on a document.
In a sales proposal, a heatmap might show that readers spend the most time on the pricing page, testimonials, project timeline, or call-to-action section.
In a pitch deck, it might show that investors spend more time on traction, business model, or market opportunity slides than product screenshots.
In a client report, it might show which pages the client actually reviewed before the next meeting.
Instead of only knowing that a document was opened, a document heatmap helps answer:
- Which pages got the most attention?
- Where did the reader click?
- How far did they scroll?
- Which parts were ignored?
- Did they return to the document later?
- Did another viewer open the document?
That matters because most important documents are not just files. They are part of a decision.
A proposal can affect a sale.
A pitch deck can affect fundraising.
A report can affect client trust.
A pricing page can affect whether someone moves forward.
Document heatmaps help you understand what happened inside the document after the link was opened.
How Document Heatmaps Work
Different tools may show heatmaps in different ways, but most document heatmaps are based on engagement signals.
These signals can include:
- Clicks: where readers clicked or interacted
- Scroll depth: how far readers moved through the document
- Time spent: which pages or sections held attention longer
- Page views: which pages were opened, skipped, or revisited
- Viewer activity: whether the same person returned later
- New viewer detection: whether the document may have been forwarded
Heatmaps can be shown for a single viewer or across multiple viewers.
Individual Heatmaps
An individual heatmap helps you understand one person’s engagement.
For example, if a prospect spends most of their time on your pricing page, that may be a useful follow-up signal.
It does not prove they think the price is too high. But it suggests pricing may be part of the conversation.
Aggregate Heatmaps
An aggregate heatmap combines activity across multiple viewers.
This helps you improve the document itself.
For example, if ten prospects all stop before page three, the problem may not be the prospect. The problem may be the proposal.
Maybe the intro is too long.
Maybe the value is not clear enough.
Maybe the pricing section comes too late.
Maybe the strongest proof point is buried too far down.
That is where document heatmaps become useful beyond one deal.
They help you improve the next version of the document.
What You Can Learn From a Document Heatmap
A heatmap helps you understand the story behind the view.
Without heatmaps, you may only know that someone opened your proposal.
With heatmaps, you can see what they seemed to care about.
Here are a few common examples.
They Spend Most of Their Time on Pricing
If a prospect spends the most time on your pricing page, cost may be part of the decision.
That does not mean they are rejecting the price. It could mean they are comparing options, checking budget fit, or preparing to discuss it with someone else.
A better follow-up could be:
“Happy to walk through the pricing or scope if helpful. There are a few ways we can adjust the package depending on your priorities.”
That is more useful than:
“Just checking in.”
They Revisit the Case Study Page
If a reader keeps coming back to a case study, testimonial, or results page, they may be looking for proof.
That could mean your follow-up should focus on credibility, examples, and outcomes.
A useful follow-up could be:
“I can also send over a similar example from a client with a comparable workflow if that would help.”
They Do Not Scroll Past the First Page
If readers do not make it past the first page, your document may have a weak opening.
The first page may be too generic.
The value proposition may not be clear.
The document may start with too much background before getting to the real offer.
That is a document problem you can fix.
They Reopen the Document Multiple Times
If a prospect opens the document more than once, that may suggest active evaluation.
They may be reviewing it before a meeting, comparing it with alternatives, or sharing it with someone else.
That is usually a stronger signal than a single open.
A New Viewer Appears
If a new viewer opens the document, the proposal may have been forwarded internally.
That can be a strong buying signal because it may mean another stakeholder is now involved.
A useful follow-up could be:
“Would it be helpful to include anyone else from your team in the next conversation?”
Why Heatmaps Matter for Sales Documents
Most sales documents are created based on opinions.
The founder wants one section.
The sales rep wants another section.
The designer wants it to look clean.
The client wants it to be short.
Everyone has a view.
But reader behavior tells you what is actually working.
If nobody scrolls past the first two pages, the document may need a stronger opening.
If everyone spends time on the pricing section, you may need clearer packaging.
If readers keep returning to your case study page, that may be the proof point that helps close deals.
If people skip your process section, maybe it is too detailed.
If they stop before the call-to-action, the document may be too long.
A document heatmap helps improve two things:
- The follow-up you send to each prospect
- The document you send to future prospects
That is the real advantage.
Heatmaps do not just help you sell this deal. They help you improve the next version of your proposal, pitch deck, or report.
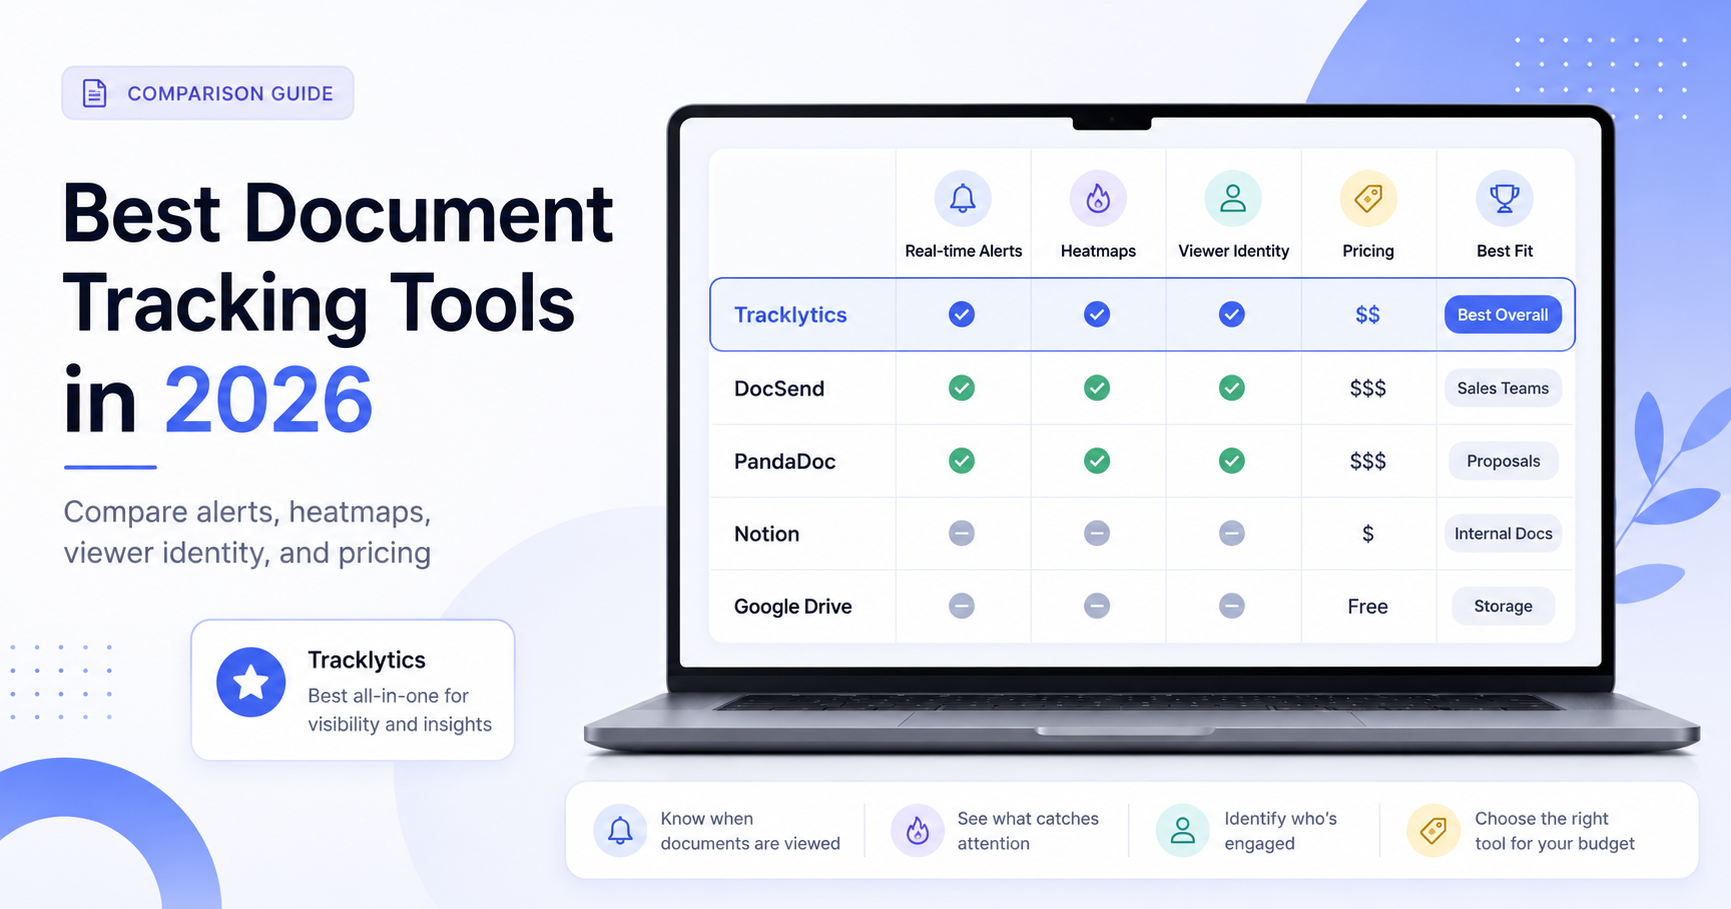
Document Heatmaps vs. Normal PDF Analytics
Basic PDF analytics can tell you that someone opened a document.
That is helpful, but it is not enough.
A document heatmap gives more context.
It helps you understand what happened inside the document after the open.
| Feature | Basic PDF Analytics | Document Heatmap |
|---|---|---|
| Shows document opens | Yes | Yes |
| Shows page-level activity | Sometimes | Yes |
| Shows where readers engaged | No | Yes |
| Shows scroll or click behavior | No | Yes |
| Helps improve follow-up timing | Limited | Yes |
| Helps improve future document versions | Limited | Yes |
If your document is tied to revenue, knowing “opened” is only the first step.
The more important question is:
“What did they care about?”
That is where heatmap-style analytics become useful.
Document Heatmaps vs. Website Heatmaps
Website heatmaps and document heatmaps are similar, but they are used in different contexts.
A website heatmap helps you understand how visitors interact with a webpage.
A document heatmap helps you understand how viewers interact with a shared file, such as a:
- Proposal
- Pitch deck
- PDF report
- Sales deck
- Client update
- Case study
- Pricing document
- Scope of work
Website heatmaps are useful for improving landing pages and websites.
Document heatmaps are useful for improving sales conversations, proposal follow-ups, investor outreach, and client communication.
For example, a website heatmap might show that visitors are not clicking your call-to-action button.
A document heatmap might show that prospects keep reviewing your pricing page before a sales call.
Both are useful, but document heatmaps are more focused on what happens after you send a specific document to a specific person or company.
Why Reading Patterns Matter
People do not always read digital content from top to bottom like a book.
They skim. They scan. They jump to sections that matter to them.
Nielsen Norman Group has written about common digital reading patterns, including the F-shaped scanning pattern, where people often focus more attention near the top and left side of a content area.
You can read their article here:
https://www.nngroup.com/articles/f-shaped-pattern-reading-web-content/
This matters for proposals and pitch decks because your reader may not carefully read every page.
They may jump straight to:
- Pricing
- Timeline
- Deliverables
- Case studies
- Results
- Team
- Risk
- Next steps
A document heatmap helps you see whether readers are engaging with the parts of the document you expected them to care about.
If they are not, you can adjust the structure.
How Sales Teams Can Use Document Heatmaps
Document heatmaps are useful because they help sales teams follow up with more context.
Here are practical ways to use them.
1. Prioritize Warm Prospects
If one prospect opens your proposal three times and another never opens it, those leads should not be treated the same.
The first prospect may be warmer.
Heatmaps and engagement signals can help you decide where to spend your time.
2. Personalize Follow-Ups
Instead of sending generic follow-ups, you can tailor your message based on engagement.
If someone spent time on pricing, follow up around scope and packages.
If someone reviewed case studies, follow up with proof.
If someone did not open the document, resend it or offer a shorter summary.
3. Improve Proposal Structure
If prospects consistently drop off before the offer, your proposal may need a better structure.
You may need to move the strongest value proposition earlier.
You may need to simplify the intro.
You may need to bring pricing or proof closer to the top.
4. Prepare Better Sales Calls
Before a follow-up call, review the document activity.
You can see which sections the prospect engaged with and prepare accordingly.
That makes the call more relevant.
5. Understand Stakeholder Interest
If a document gets opened by a new viewer, it may have been shared internally.
That can help you understand whether the deal is moving beyond one person.
How Tracklytics Heatmaps Work
Tracklytics is built to help you understand how people engage with your documents after you send them.
With Tracklytics, you can track document opens, page-level activity, clicks, scroll depth, and heatmap-style engagement.
You can review activity by viewer or look at patterns across multiple viewers.
That means you can answer questions like:
- Which pages do prospects care about most?
- Where do they drop off?
- Are they reviewing pricing?
- Did someone else open the document?
- Is this prospect warm enough for a follow-up?
- Which parts of the document should be improved?
Instead of sending a PDF and hoping, you get a clearer view of what happened.
Tracklytics is especially useful for:
- Founders sending pitch decks
- Sales teams sending proposals
- Agencies sending client reports
- Consultants sending scopes of work
- Marketers sharing gated resources
- B2B teams tracking buyer engagement
You can learn more about Tracklytics here:
When You Should Use a Document Heatmap
You should use a document heatmap when the document matters to a business outcome.
For example:
- You are sending a proposal to a sales prospect
- You are sending a pitch deck to an investor
- You are sending a report to a client
- You are sending pricing to a buyer
- You are sharing a case study with a lead
- You are sending a scope of work before closing a deal
If the document is important enough to follow up on, it is probably important enough to track.
A static PDF gives you no context.
A document heatmap gives you signals you can act on.
What a Document Heatmap Cannot Tell You
A document heatmap is useful, but it has limits.
It cannot tell you exactly what someone is thinking.
It cannot prove why someone spent time on a section.
It cannot guarantee that a viewer is interested.
It cannot replace a real conversation with the prospect.
A heatmap should be used as a signal, not as a final answer.
For example, if someone spends time on pricing, it may mean pricing matters. But you still need to ask good questions and understand their needs.
The best sales teams use heatmaps to guide better conversations, not to make assumptions.
Try Document Heatmaps With Tracklytics
Tracklytics helps sales teams, founders, consultants, agencies, and marketers see how people engage with shared documents.
You can track opens, clicks, scroll depth, page-level engagement, and heatmap-style signals for your PDFs, pitch decks, proposals, and reports.
Instead of wondering whether someone read your document, Tracklytics helps you see what happened after the link was opened.
Try Tracklytics free:
Also read:
How to Know When a Prospect Opens Your Proposal
About Tracklytics
Tracklytics is a PDF analytics and document tracking platform that helps teams understand how readers engage with shared documents.
For heatmaps, Tracklytics is focused on showing engagement patterns that help sales teams, founders, agencies, consultants, and marketers improve both their documents and their follow-up timing.
Instead of only knowing that a document was opened, Tracklytics helps answer what happened inside the document.
With Tracklytics, teams can move from guessing to following up with better context.
FAQ
What Is a Document Heatmap?
A document heatmap is a visual way to understand how someone engages with a PDF, proposal, pitch deck, or report.
It can show areas of higher attention, clicks, scroll activity, time spent, or page-level engagement.
Why Do Sales Teams Use Document Heatmaps?
Sales teams use document heatmaps to understand which parts of a proposal prospects care about most.
This helps them follow up with more relevant messages and improve future proposals.
Can Heatmaps Show Pricing Interest?
Yes. If a prospect spends more time on a pricing page or pricing section, that may suggest pricing is important to their decision.
It does not prove what they are thinking, but it gives your follow-up more context.
Does Tracklytics Support PDF Heatmap Analytics?
Tracklytics is built around PDF analytics, document engagement tracking, and heatmap-style insights for shared documents.
It helps teams understand opens, page-level engagement, clicks, scroll depth, and reader behavior after a document is shared.
Are Document Heatmaps the Same as Eye Tracking?
Not always.
Some heatmaps are based on eye-tracking studies, but most document heatmaps in sales tools are based on engagement signals like clicks, scroll depth, time spent, and page activity.
Unless a tool specifically uses gaze tracking, it is better to describe the feature as engagement-based heatmap analytics.
Are Document Heatmaps Useful for Pitch Decks?
Yes.
Founders can use document heatmaps to see which slides investors view, where they spend the most time, and whether the deck gets reopened or forwarded.
That can help founders follow up with better context.
Are Document Heatmaps Useful for Agencies?
Yes.
Agencies can use document heatmaps to understand whether clients review proposals, reports, scopes of work, and pricing sections.
This can improve client communication, reporting calls, and renewal conversations.
What Is the Difference Between PDF Analytics and a Document Heatmap?
PDF analytics usually tells you things like opens, views, and time spent.
A document heatmap adds visual context by showing where readers engaged inside the document.
That makes it easier to understand what sections are working and what sections may need improvement.
Stop guessing. Start knowing.
Track when prospects open your proposals, see which pages they read, and follow up at exactly the right moment.
Try Tracklytics free →